
Los sistemas NAS se han convertido en una pieza clave dentro de muchos homelab y entornos domésticos, ya que permiten centralizar almacenamiento, copias de seguridad y servicios en la red local. Integrarlos con un sistema de domótica puede aportar todavía más valor, permitiendo supervisar su estado y reaccionar ante distintos eventos.
En este artículo veremos cómo integrar un UGREEN NAS en Home Assistant, de forma que puedas monitorizar desde tu panel de control aspectos como el estado del dispositivo, el uso del almacenamiento o la conectividad. De este modo, tu NAS pasa a formar parte de tu ecosistema domótico y podrás automatizar alertas o acciones en función de su estado.
Instalación de la integración
Accedemos a Hacs y en el buscador buscamos "ugreen":
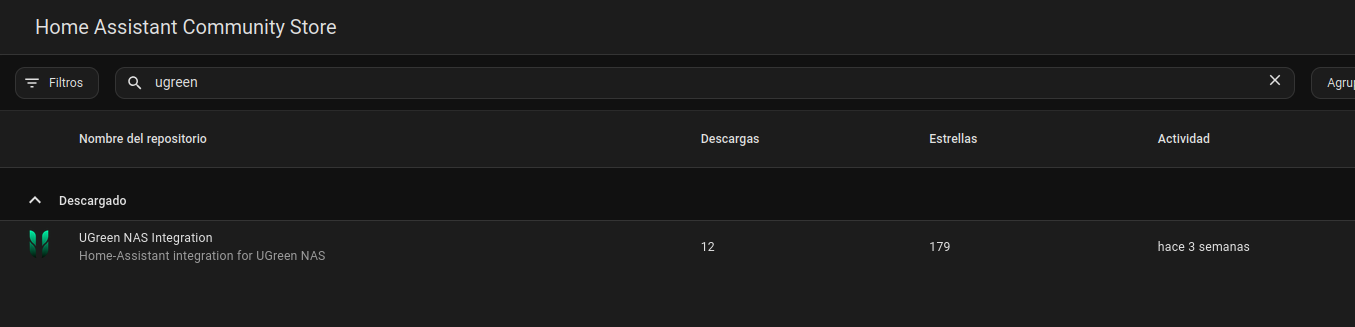
Hacemos clic sobre la integración y le damos a instalar.
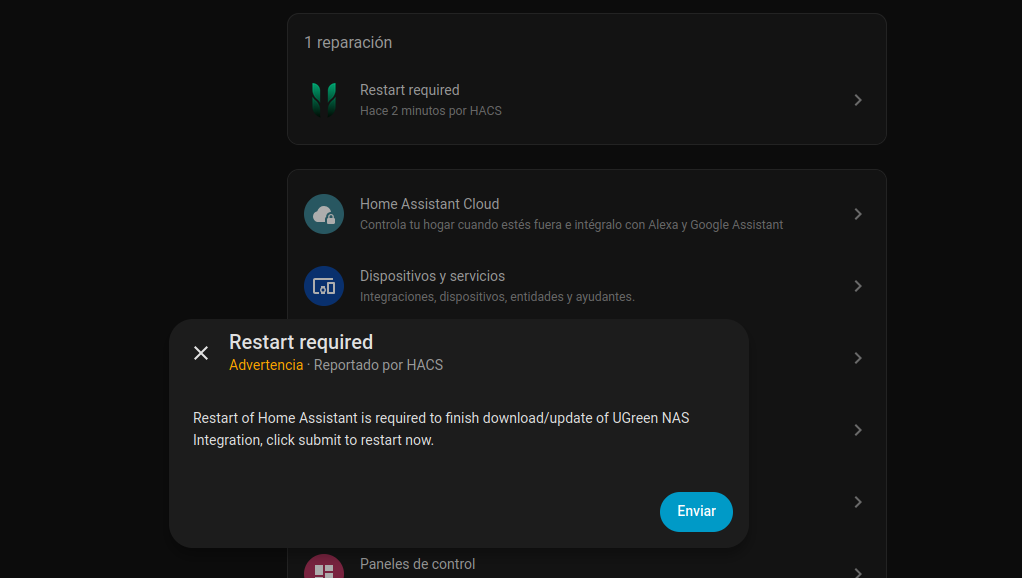
Tras la instalación, nos parecerá una notificación para reiniciar Home Assistant, hacemos clic para iniciar Home Assistant y esperamos a que inicie de nuevo.
Tras iniciar de nuevo Home Assistant, vamos a Configuración - Dispositivos y Servicios y luego hacemos clic Añadir Integración.
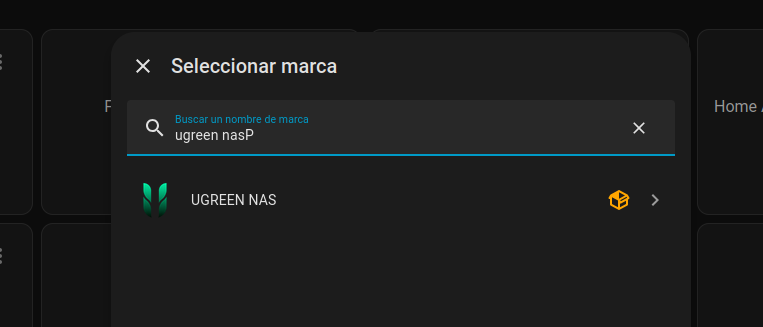
Hacemos clic sobre la integración para iniciar la configuración:
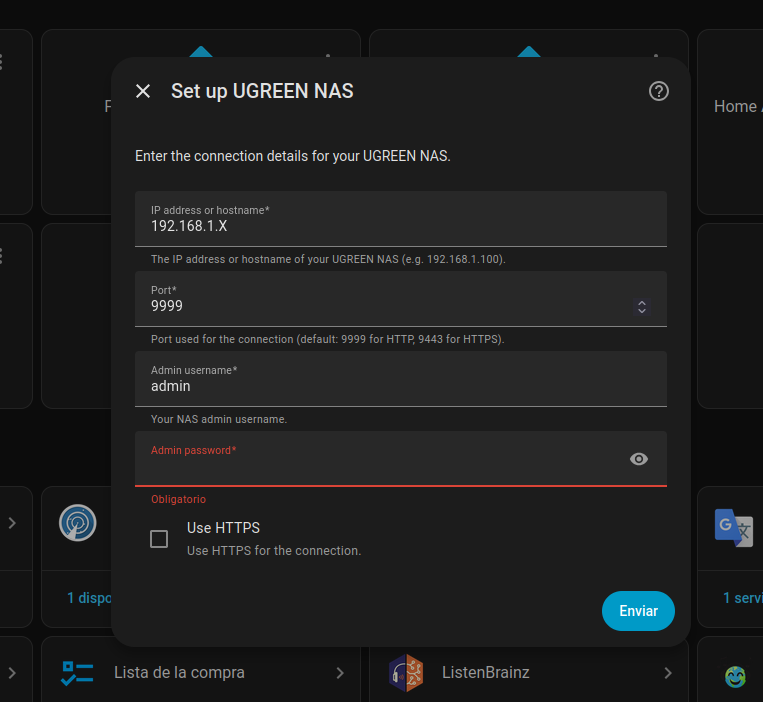
- IP address or hostname: La IP o nombre del NAS en tu red (por ejemplo
192.168.1.50onas.local). - Port: El puerto del panel web del NAS (por defecto es el puerto
9999). - Admin username: Tu nombre de usuario con el que accedes al NAS.
- Admin password: La contraseña del usuario anterior.
- Use HTTPS: Actívalo si accedes al NAS mediante
https://.
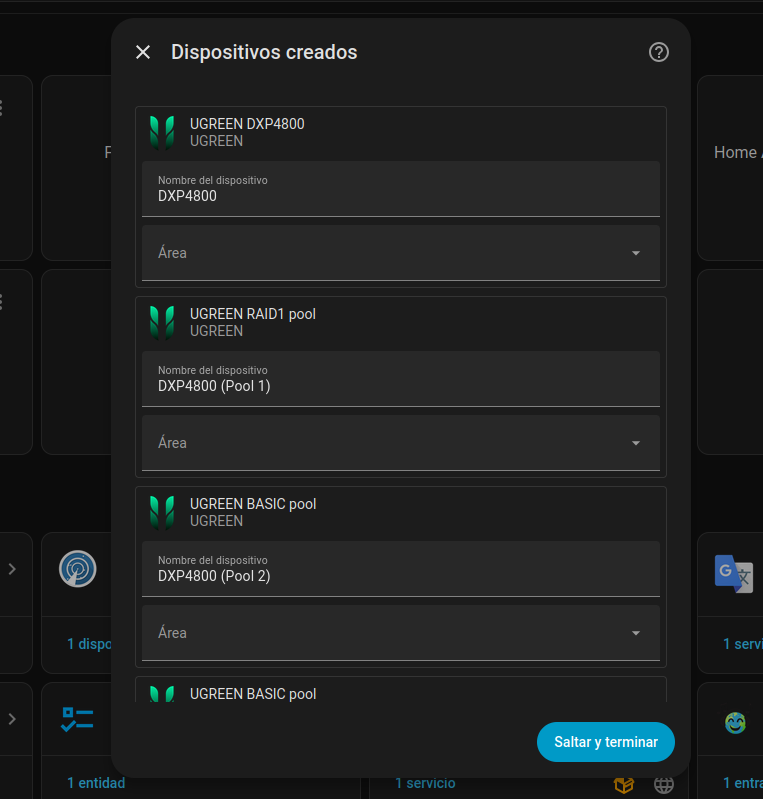
Tras configurar todos los datos, le damos al botón de Enviar y nos aparecerán los dispositivos para configurar las zonas en las que se encuentran:
Añadir Dasboard completo para UGREEN NAS
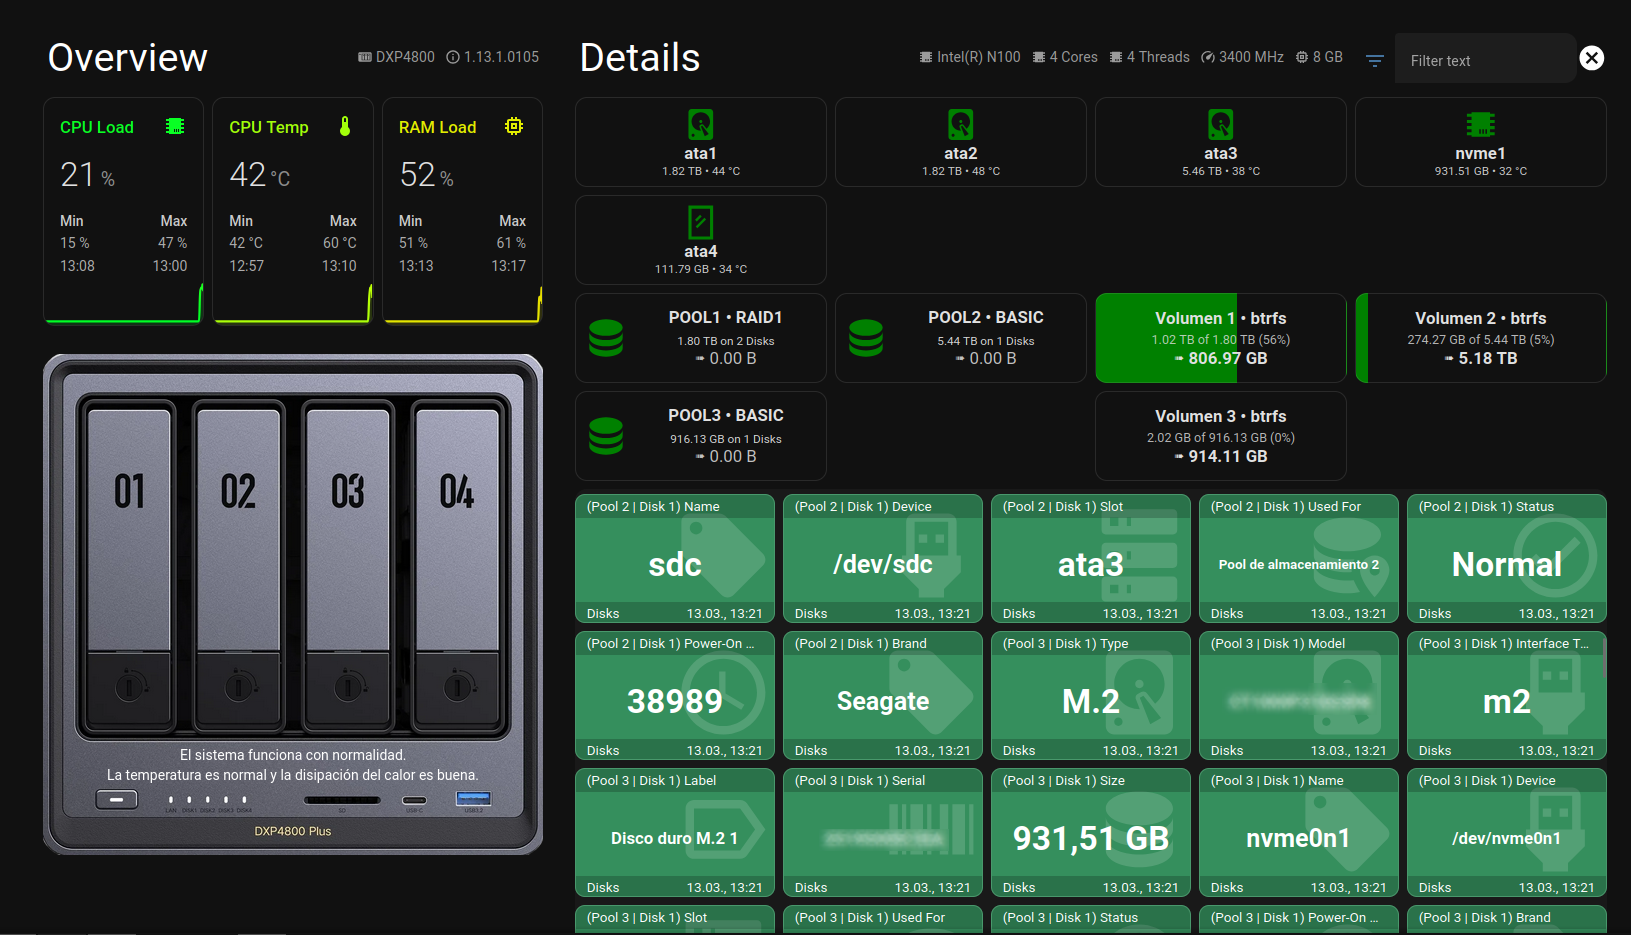
El autor de la integración también ha creado un dashboard completo para visualizar de forma clara todos los datos del NAS. A continuación podéis ver un ejemplo:
A continuación veremos cómo configurar este dashboard en Home Assistant. Mi recomendación es crear un dashboard nuevo o específico para UGREEN.
Accede al dashboard y, en la parte superior derecha, haz clic en el icono del lápiz para entrar en modo edición. Después, pulsa en el menú de los tres puntos y selecciona Editor de configuración en bruto.
Si se trata de un dashboard nuevo, en el editor aparecerá una configuración similar a la siguiente:
views:
  - type: sections
    max_columns: 4
    title: NAS
    path: nas
    sections: []
Encima de todo esto, en la primera línea del archivo, debéis añadir el siguiente código:
button_card_templates:
  ugreen_nas_template:
    name: |
      [[[
        return entity && entity.attributes && entity.attributes.friendly_name
          ? entity.attributes.friendly_name.replace(/^UGREEN NAS /, "")
          : entity.entity_id;
      ]]]
    show_icon: false
    show_state: true
    show_name: true
    tap_action:
      action: more-info
    styles:
      card:
        - background-color: |
            [[[
              const type = entity.attributes.UGNAS_part_category || '';
              switch (type) {
                case 'Device':
                  return '#B8860B';
                case 'Hardware':
                  return '#4682B4';
                case 'Status':
                  return '#556B2F';
                case 'Network':
                  return '#008080';
                case 'Disks':
                  return '#2E8B57';
                case 'Pools':
                  return '#483D8B';
                case 'Volumes':
                  return '#2F4F4F';
                case 'USB':
                  return '#468499';
                case 'UPS':
                  return '#468499';
                case 'Summary':
                  return '#5DADE2';
                case 'Cache':
                  return '#708090';
                default:
                  return '#8B0000';
              }
            ]]]
        - border-radius: 10px
        - min-height: 13vh
        - height: 13vh
        - padding: 0px
        - display: grid
        - grid-template-rows: auto 1fr auto
        - grid-template-columns: 1fr
        - position: relative
        - overflow: hidden
      name:
        - font-size: 0.8em
        - color: white
        - z-index: 2
        - justify-self: stretch
        - align-self: start
        - width: 100%
        - background-color: rgba(0, 0, 0, 0.2)
        - padding: 0.2em 0.8em
        - box-sizing: border-box
        - text-align: left
        - margin-top: 0px
      state:
        - display: grid
        - place-items: center
        - text-align: center
        - color: white
        - font-size: 1.2em
        - font-weight: bold
        - z-index: 2
        - white-space: normal
        - word-break: break-word
        - overflow-wrap: break-word
        - margin-top: '-1.75vh'
        - width: 100%
        - padding: 0 4px
        - height: 7vh
        - overflow: hidden
        - text-overflow: ellipsis
        - '-webkit-line-clamp': 2
        - '-webkit-box-orient': vertical
        - font-size: |
            [[[
              const len = entity.state.length;
              if (len <= 6) return '2em';
              if (len <= 10) return '1.5em';
              if (len <= 20) return '1em';
              return '0.8em';
            ]]]
      custom_fields:
        icon_bg:
          - position: absolute
          - top: 10px
          - right: 0px
          - width: 6em
          - opacity: 0.15
          - z-index: 1
        footer:
          - background-color: rgba(0, 0, 0, 0.2)
          - color: white
          - font-size: 0.8em
          - display: grid
          - grid-template-columns: 1fr auto
          - align-items: center
          - padding: 0 0.8em
          - height: 1.5em
          - width: 100%
          - box-sizing: border-box
          - z-index: 2
          - position: absolute
          - bottom: 0
          - left: 0
    custom_fields:
      icon_bg: |
        [[[
          const stateObj = entity;
          const icon = stateObj && stateObj.attributes && stateObj.attributes.icon
            ? stateObj.attributes.icon
            : 'mdi:help-circle';
          return `
            <ha-icon
              icon="${icon}"
              style="height: 100%; width: auto; color: white;">
            </ha-icon>
          `;
        ]]]
      footer: |
        [[[
          if (entity && entity.last_changed) {
            const date = new Date(entity.last_changed);
            return `
              <div style="display: contents;">
                <span style="justify-self: start; padding-top: 2px;">
                  ${entity.attributes.UGNAS_part_category || ''}
                </span>
                <span style="justify-self: end; padding-top: 2px;">
                  ${date.toLocaleString('de-DE', {
                    day: '2-digit', month: '2-digit',
                    hour: '2-digit', minute: '2-digit'
                  })}
                </span>
              </div>
            `;
          } else {
            return `
              <div style="display: contents;">
                <span style="justify-self: start; padding-top: 2px;"></span>
                <ha-icon icon="mdi:arrow-right" style="justify-self: end; width:1em; height:1em;"></ha-icon>
              </div>
            `;
          }
        ]]]
El final del documento debe quedar así:
          } else {
            return `
              <div style="display: contents;">
                <span style="justify-self: start; padding-top: 2px;"></span>
                <ha-icon icon="mdi:arrow-right" style="justify-self: end; width:1em; height:1em;"></ha-icon>
              </div>
            `;
          }
        ]]]
views:
  - type: sections
    max_columns: 4
    title: NAS
    path: nas
    sections: []
Ahora guarda los cambios y abre tu editor favorito de Home Assistant para editar el archivo configuration.yaml.
Si todavía no utilizas ningún editor, en este artículo hablamos de varias opciones que puedes usar para hacerlo fácilmente.

Dentro del fichero de configuración de Home Assistant debemos añadir lo siguiente:
input_text:
  filter_text:
    name: Filter text
    initial: ""
Guardamos los cambios y reiniciamos Home Assistant para que la nueva configuración se aplique correctamente.
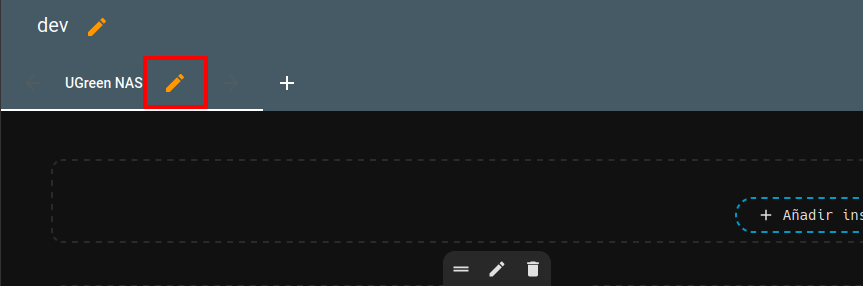
Una vez iniciado de nuevo, volvemos al dashboard que hemos creado antes. Pulsamos otra vez el icono del lápiz para entrar en modo edición y, a continuación, hacemos clic en el segundo lápiz para editar directamente el dashboard.
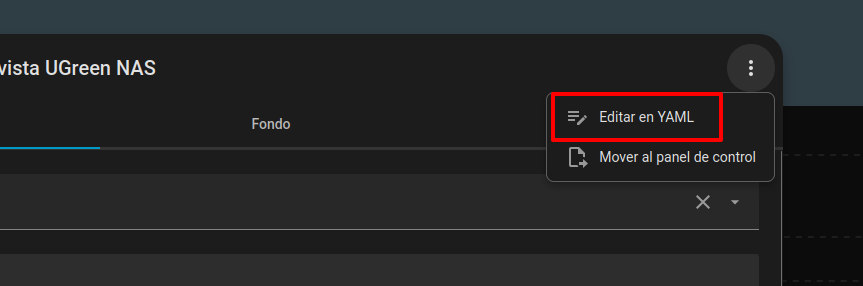
En la ventana que se abra, haz clic en los tres puntos de la esquina superior derecha y selecciona la opción Editar en YAML.
Elimina el contenido que aparece actualmente en este apartado y pega en su lugar el siguiente código. Asegúrate de reemplazarlo completamente para evitar errores en la configuración.
title: UGreen NAS
path: ugreen-nas
type: sections
max_columns: 3
header:
card:
type: markdown
text_only: true
content: " "
cards: []
sections:
- type: grid
cards:
- type: heading
heading: Overview
heading_style: title
badges:
- type: entity
entity: sensor.ugreen_nas_nas_model
- type: entity
entity: sensor.ugreen_nas_nas_ugos_version
card_mod:
style: |
ha-card {
background: transparent;
}
ha-card .content.title p,
ha-card .content.subtitle p {
margin: 0;
font-size: 4vh;
color: white;
}
- type: horizontal-stack
cards:
- type: custom:mini-graph-card
hours_to_show: 24
points_per_hour: 10
animate: true
hour24: true
height: 150
entities:
- sensor.ugreen_nas_cpu_usage
icon: mdi:chip
decimals: 0
state_adaptive_color: true
show_state: true
name: CPU Load
line_color: "#00ff26"
line_width: 7
color_thresholds:
- value: 20
color: "#00ff26"
- value: 50
color: "#ddff00"
- value: 60
color: "#ff8c00"
- value: 80
color: "#ff5900"
- value: 90
color: "#ff0000"
show:
extrema: true
name_adaptive_color: true
icon_adaptive_color: true
card_mod:
style: |
ha-card {
background: transparent;
}
- type: custom:mini-graph-card
hours_to_show: 24
points_per_hour: 10
animate: true
hour24: true
height: 150
entities:
- sensor.ugreen_nas_cpu_temperature
state_adaptive_color: true
show_state: true
name: CPU Temp
line_color: "#00ff26"
line_width: 7
color_thresholds:
- value: 20
color: "#00ff26"
- value: 50
color: "#ddff00"
- value: 60
color: "#ff8c00"
- value: 80
color: "#ff5900"
- value: 90
color: "#ff0000"
show:
extrema: true
name_adaptive_color: true
icon_adaptive_color: true
card_mod:
style: |
ha-card {
background: transparent;
}
- name: RAM Load
type: custom:mini-graph-card
hours_to_show: 24
points_per_hour: 10
animate: true
hour24: true
height: 150
entities:
- sensor.ugreen_nas_ram_usage
decimals: 0
icon: mdi:memory
state_adaptive_color: true
show_state: true
line_color: "#00ff26"
line_width: 7
color_thresholds:
- value: 20
color: "#00ff26"
- value: 50
color: "#ddff00"
- value: 60
color: "#ff8c00"
- value: 80
color: "#ff5900"
- value: 90
color: "#ff0000"
show:
extrema: true
name_adaptive_color: true
icon_adaptive_color: true
card_mod:
style: |
ha-card {
background: transparent;
}
- type: picture-elements
card_mod:
style: |
ha-card {
margin-top: 20px;
border: 0;
background: transparent;
}
elements:
- type: state-label
style:
left: 50%
top: 80%
color: white
entity: sensor.ugreen_nas_system_message
- type: state-label
style:
left: 50%
top: 84%
color: white
entity: sensor.ugreen_nas_temperature_message
image: /local/images/ugreen_dxp.png
grid_options:
columns: full
- type: grid
column_span: 2
cards:
- type: heading
heading: Details
heading_style: title
grid_options:
columns: 18
rows: 1
badges:
- type: entity
show_state: true
show_icon: true
entity: sensor.ugreen_nas_cpu_model
- type: entity
entity: sensor.ugreen_nas_cpu_cores
- type: entity
entity: sensor.ugreen_nas_cpu_threads
- type: entity
entity: sensor.ugreen_nas_cpu_speed
- type: entity
entity: sensor.ugreen_nas_ram_total_size
card_mod:
style: |
ha-card {
background: transparent;
}
ha-card .content.title p,
ha-card .content.subtitle p {
margin: 0;
font-size: 4vh;
color: white;
}
- type: custom:button-card
entity: none
show_icon: false
show_name: false
styles:
card:
- background: transparent
- box-shadow: none
- border: none
- padding: 0
- margin: 0
grid:
- grid-template-areas: "\"left right\""
- grid-template-columns: 1fr 3vh
- grid-template-rows: 5vh
custom_fields:
left:
card:
type: entities
entities:
- entity: input_text.filter_text
icon: mdi:filter-variant
card_mod:
style: |
ha-card {
background: transparent;
border-style: none;
max-height: 5vh !important;
overflow: hidden;
}
#states {
padding: 0;
margin: 0;
}
hui-text-entity-row {
display: flex;
align-items: center;
height: 3vh;
}
ha-icon {
}
paper-input, paper-input input {
color: white !important;
font-size: 2vh !important;
}
right:
card:
type: custom:button-card
entity: input_text.filter_text
icon: mdi:close-circle
tap_action:
action: call-service
service: input_text.set_value
service_data:
entity_id: input_text.filter_text
value: ""
show_state: false
show_name: false
styles:
card:
- background: transparent
- box-shadow: none
- border: none
- padding: 0
- margin: 0
- width: 3vh
- height: 3vh
- border-radius: 50%
icon:
- color: white
- width: 100%
- height: 100%
grid_options:
rows: 1
columns: 6
- type: custom:auto-entities
show_empty: false
card_param: cards
card:
type: grid
columns: 4
square: false
grid_options:
columns: full
sort:
method: attribute
attribute: UGNAS_global_disk_number
filter:
include:
- attributes:
UGNAS_summary_entity_for: Disk
options:
type: custom:button-card
entity: this.entity_id
show_icon: true
show_name: true
show_state: true
show_label: false
tap_action:
action: more-info
name: |
[[[ return entity.attributes.Slot; ]]]
label: |
[[[ return 'just a dummy placeholder'; ]]]
icon: |
[[[
const disktype = entity.attributes.Type;
if (disktype == "SSD") return 'mdi:mirror-rectangle';
if (disktype == "M.2") return 'mdi:chip';
return 'mdi:harddisk';
]]]
state_display: |
[[[
return entity.attributes.Size + ' • ' +
entity.attributes.Temperature;
]]]
styles:
card:
- background-color: |
[[[
/* remove comment below for colorizing entire card */
/* if (entity.state == 'Normal') return 'rgba(0, 128, 0, 0.25)'
else return 'rgba(178, 34, 34, 0.25)'; */
return 'transparent';
]]]
- border-radius: 12px
- padding: 8px
- height: 90px
icon:
- color: |
[[[
if (entity.state == 'Normal') return 'rgba(0, 128, 0)'
else return 'var(--error-color, #f44336)';
]]]
name:
- font-weight: 600
state:
- font-size: 0.7em
- opacity: 0.9
label:
- opacity: 0.7
- font-size: 0.85em
- attributes:
UGNAS_summary_entity_for: Cache Disk
options:
type: custom:button-card
entity: this.entity_id
show_icon: true
show_name: true
show_state: true
show_label: false
tap_action:
action: more-info
name: |
[[[ return entity.attributes.Slot; ]]]
label: |
[[[ return 'just a dummy placeholder'; ]]]
icon: |
[[[
const disktype = entity.attributes.Type;
if (disktype == "SSD") return 'mdi:mirror-rectangle';
if (disktype == "M.2") return 'mdi:chip';
return 'mdi:harddisk';
]]]
state_display: |
[[[
return entity.attributes.Size + ' • ' +
entity.attributes.Temperature;
]]]
styles:
card:
- background-color: |
[[[
/* remove comment below for colorizing entire card */
/* if (entity.state == 'Normal') return 'rgba(0, 128, 0, 0.25)'
else return 'rgba(178, 34, 34, 0.25)'; */
return 'transparent';
]]]
- border-radius: 12px
- padding: 8px
- height: 90px
icon:
- color: |
[[[
if (entity.state == 'Normal') return 'rgba(0, 128, 0)'
else return 'var(--error-color, #f44336)';
]]]
name:
- font-weight: 600
state:
- font-size: 0.7em
- opacity: 0.9
label:
- opacity: 0.7
- font-size: 0.85em
- type: custom:auto-entities
show_empty: true
card_param: cards
card:
type: grid
columns: 2
square: false
sort:
method: attribute
attribute: pool_index
filter:
include:
- attributes:
UGNAS_summary_entity_for: Pool
options:
type: custom:button-card
entity: this.entity_id
show_icon: true
show_name: true
show_state: true
show_label: true
tap_action:
action: more-info
label: |
[[[
const a = entity?.attributes?.['Available Size'];
return '➠ ' + (a ?? '—');
]]]
icon: |
[[[ return 'mdi:database'; ]]]
state_display: |
[[[
const used = entity?.attributes?.['Used Size'] ?? '—';
const disks = entity?.attributes?.['Disk Count'] ?? '—';
return `${used} on ${disks} Disks`;
]]]
name: |
[[[
const n = entity?.attributes?.Name ?? entity?.attributes?.Label ?? entity?.name ?? 'POOL';
const lvl = entity?.attributes?.Level ?? entity?.attributes?.Raid ?? '';
const name = String(n).toUpperCase();
const level = String(lvl || '').toUpperCase();
return level ? `${name} • ${level}` : name;
]]]
size: 50px
styles:
grid:
- grid-template-areas: "'i n' 'i s' 'i l'"
- grid-template-columns: 50px 1fr
- grid-template-rows: auto
card:
- height: 90px
- overflow: hidden
- border-radius: 12px
- background-color: transparent
img_cell:
- margin-left: 10px
name:
- font-weight: 600
- white-space: nowrap
- overflow: hidden
- text-overflow: ellipsis
state:
- font-size: 0.7em
- opacity: 0.95
- overflow: hidden
- text-overflow: ellipsis
label:
- opacity: 0.85
- margin-top: "-6px"
- font-size: 1em
- white-space: nowrap
- overflow: hidden
- text-overflow: ellipsis
icon:
- color: |
[[[ return entity.state === "Normal"
? "rgba(0,128,0)"
: "var(--error-color,#f44336)";
]]]
- type: custom:auto-entities
show_empty: true
card_param: cards
card:
type: grid
columns: 2
square: false
sort:
method: attribute
attribute: volume_index
filter:
include:
- attributes:
UGNAS_summary_entity_for: Volume
options:
type: custom:button-card
entity: this.entity_id
show_icon: false
show_name: true
show_state: true
show_label: true
tap_action:
action: more-info
name: |
[[[
return entity.attributes.Label + " • " + entity.attributes.Filesystem;
]]]
label: |
[[[
return '➠ ' + entity?.attributes?.['Available Size'];
]]]
state_display: |
[[[
const attribs = entity?.attributes || {};
const pool = attribs.UGNAS_pool_index;
const vol = attribs.UGNAS_volume_index;
const base = `sensor.ugreen_nas_pool_${pool}_volume_${vol}`;
const used = Number(hass.states[`${base}_used_size_raw` ]?.state);
const total = Number(hass.states[`${base}_total_size_raw`]?.state);
const percent = Math.round((used*100)/total);
return `<small>
${attribs['Used Size']} of
${attribs['Total Size']}
(${percent}%)
</small>`;
]]]
styles:
card:
- height: 90px
- border-radius: 12px
- background-color: transparent
- box-shadow: none
- background: |
[[[
const attribs = entity?.attributes || {};
const pool = attribs.UGNAS_pool_index;
const vol = attribs.UGNAS_volume_index;
const base = `sensor.ugreen_nas_pool_${pool}_volume_${vol}`;
const used = Number(hass.states[`${base}_used_size_raw` ]?.state);
const total = Number(hass.states[`${base}_total_size_raw`]?.state);
const percent = Math.round((used*100)/total);
// Main color
let rgb = '0,128,0'; // green
if (percent >= 90) rgb = '178,34,34'; // red
else if (percent >= 75) rgb = '255,165,0'; // orange
else if (percent >= 66) rgb = '204,204,0'; // yellow
// Only draw main color to percentage used, rest transparent
return `linear-gradient(to right,
rgba(${rgb},1) 0%,
rgba(${rgb},1) ${percent}%,
rgba(${rgb},0) ${percent}%,
rgba(${rgb},0) 100%)`;
]]]
name:
- font-size: 1em
- font-weight: 600
- white-space: nowrap
- overflow: hidden
- text-overflow: ellipsis
state:
- font-size: 0.9em
- opacity: 0.8
- white-space: nowrap
- overflow: hidden
- text-overflow: ellipsis
label:
- font-size: 1em
- font-weight: 600
- white-space: nowrap
- overflow: hidden
- text-overflow: ellipsis
- type: custom:button-card
entity: none
card_mod:
style: |
ha-card {
width: 100% !important;
background: transparent;
overflow: hidden;
padding: 0px !important;
border: 0;
}
grid:
- grid-template-areas: ugreen-entities
grid_options:
columns: 24
styles:
custom_fields:
ugreen-entities:
- height: 55vh
- max-height: 55vh
- overflow-y: auto
- margin: 0
- background-color: transparent
custom_fields:
ugreen-entities:
card:
type: custom:auto-entities
card:
type: grid
columns: 5
square: false
card_param: cards
filter:
include: |
[[[
const search = states['input_text.filter_text'].state.toLowerCase();
return Object.values(states)
.filter(e => e.entity_id.startsWith('sensor.ugreen_nas'))
.filter(e => search === '' || (e.attributes.friendly_name || '').toLowerCase().includes(search))
.filter(e => !e.entity_id.endsWith('_raw'))
.map(e => ({
entity: e.entity_id,
type: 'custom:button-card',
template: 'ugreen_nas_template'
}));
]]]
sort:
method: attribute
attribute: UGNAS_part_category
grid_options:
columns: 24
rows: autoPulsa Guardar y listo. El panel quedará creado y ya podrás visualizar toda la información del NAS directamente desde el dashboard.
Más sobre ./voidNull
- 📖 Aprende todos sobre los comandos de GNU/Linux en nuestro Diccionario "De la A a la Z: Los comandos de GNU/Linux"
- 💪 ¡Forma parte de la Comunidad de ./voidNull!
- 🤖 Disfruta de todos nuestros Cursos sobre Ansible, Proxmox, Home Assistant entre otros.
- 📩 Mantente actualizado con lo último en GNU/Linux y Software Libre. Recibe nuestra Newsletter mensual.


Comentarios